Cloud Globe
September 2012 | By Google Data Arts Team
This experiment is no longer active, but you can still learn about it on this page.
Collection:
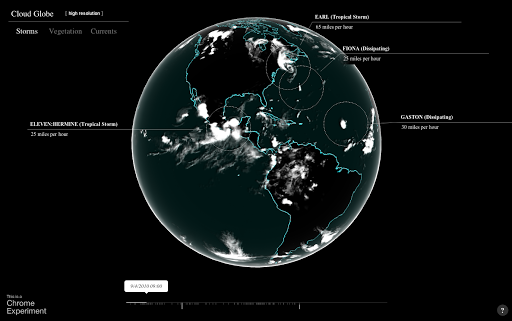

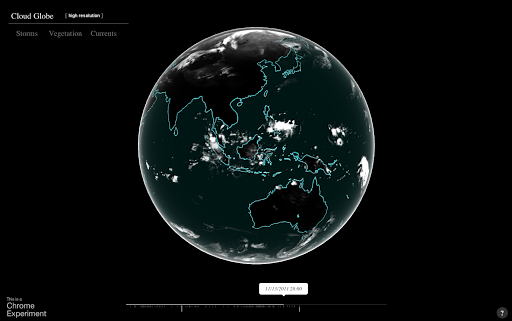
Cloud Globe is an interactive visualization of cloud data from July 1, 2010 to September 12, 2012. The imagery was compiled from an archive of hourly snapshots used to create the weather layer in Google Maps. To see current global cloud cover, visit Google Maps, turn on the Weather layer, then zoom out to the global view.
Please note: at the time this visualization was created (September 2012), storm data was only available for 2010 and 2011.