GTUG growth visualization
June 2011 | By Renato Mangini
Collection:

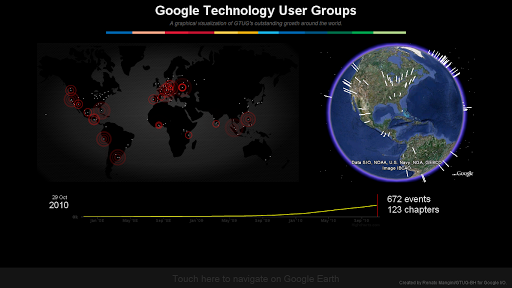
This experiment is a visualization for the impressive growth Google Technologies User Groups (GTUGs) have been during the past two years. It shows GTUGs being created as white dots, and every GTUG event is shown as a dynamic pulse on the map. 30 seconds after the latest event it starts to rewind (and the globe spins backwards) and starts running again from the beginning.
This experiment was shown on a large (62") screen at GTUG Lounge during the Google I/O 2011 and is being used by dozens of GTUGs all around the world.